(Updated October 29, 2017)
A lot of homes have been built in the Seattle area lately. Seattle famously has become number one in the country for the number of construction cranes. For some, this has raised one or both of these questions:
Aren’t we already building enough to make housing more affordable?
Can we ever build enough to make housing more affordable?
Because most of us basically need to work to live, jobs are a strong predictor of where people will move to or away from. And because most people will pay as much as they can, but not more than they have to, for a home near a good job, income per housing unit turns our to be a strong predictor of rent per renter. (Think about it this way: rent is what you have to bid to live near your job. When there are fewer homes than people with good incomes bidding for them, rent goes up. Because most people have about one job, income winds up being a good measure.)
As the Seattle Times notes, we aren’t building enough to keep up with job growth. But we can also use income and housing data to see how many new homes would keep up with it.
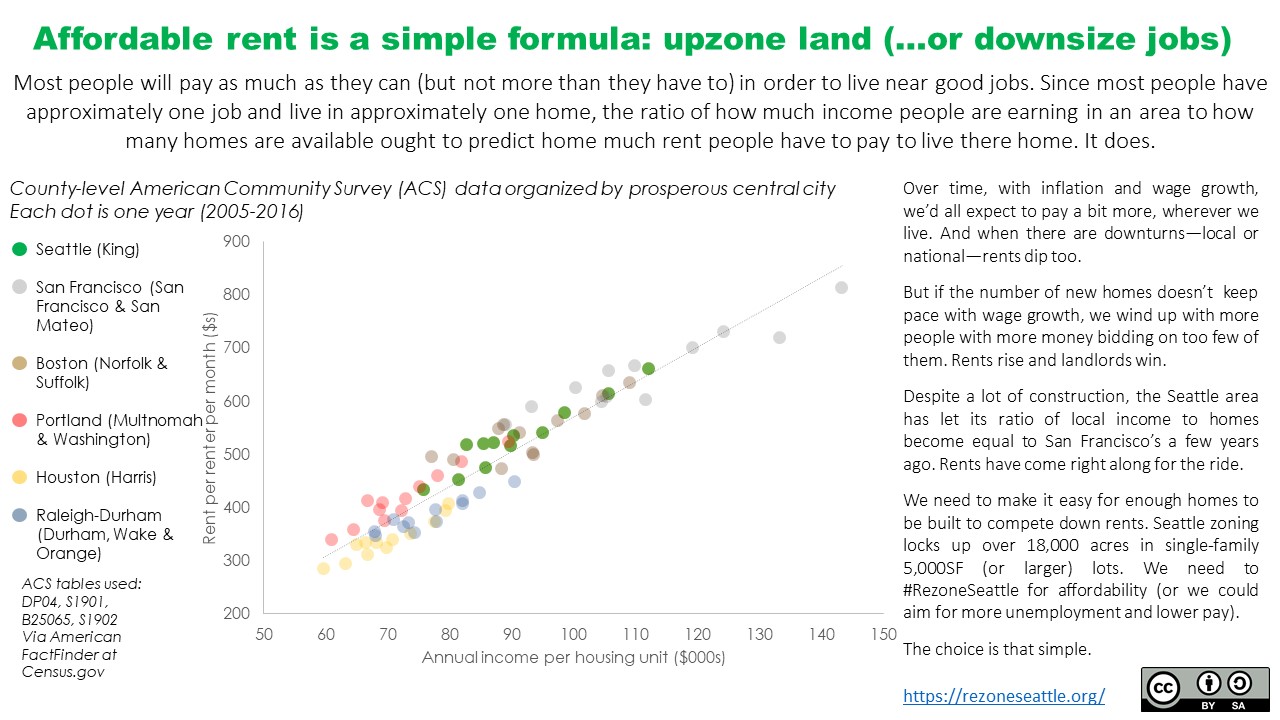
Here’s a chart showing rent per renter per month (X axis) and income per housing unit per month (Y axis) at the county level for King (Seattle and environs), Multnomah (Portland, Oregon), San Francisco and San Mateo (Silicon Valley) combined, and the US overall. Each point represents one year from 2005-2015.
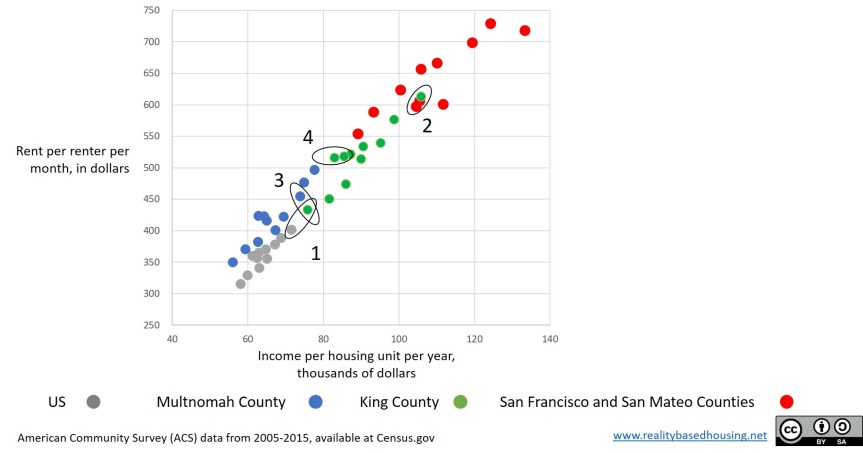
1: In 2005 King County’s annual income per housing unit was $76k, close to 2015’s US average of $71k. Rent per renter was $433 per renter per month, close to the 2015 US average of $402.
2: As King reached San Francisco-style ratios of income per home, we reached San Francisco-style rents. In 2015 our income per household was $106k, matching San Francisco’s in 2009. Our 2015 monthly rent per renter was $613. Their 2009 monthly rent per renter was $606.
3: Similarly, when Multnomah County’s income per housing unit was close to the US average, so was rent per renter. By 2014 income per housing unit ha risen to $74k, comparable to King County in 2005 ($76k). Monthly rent per renter rose to $455, close to King’s 2005 figure of $433.
4: Higher unemployment and lower wages has the same effect on rents as building more homes. For example, in King County from 2009 to 2010, income per housing unit fell from $85k to $83k and rents per renter per month fell from $518 to $516.
Q: So how much housing do we need?
A: Well it depends on what you want rent to cost. But let’s pick 2010 as our target. Between 2010 and 2015m rent per renter rose from $516 to $613 (19%). To restore the ratio of income to housing units that prevailed in 2010 (and, if the pattern shown in the chart holds true, push rents down to about that level), we need an additional 294,000 housing units county-wide. That’s a 35% increase over the 846,000 occupied units we have, or a third as many more.
Sources:
Seattle Times construction hasn’t keep up with job growth
Data is from the American Community Survey at Census.gov
